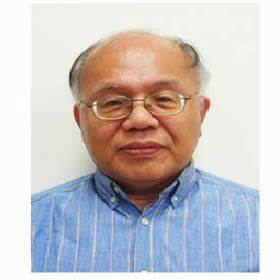
主講人:Chein-I Chang, Department of Computer Science and Electrical Engineering, University of Maryland, Baltimore County, Baltimore, USA
時(shí)間:2021年7月19日9:00-11:00(北京時(shí)間)
線下參與方式:機(jī)器人視覺感知與控制技術(shù)國(guó)家工程實(shí)驗(yàn)室 305報(bào)告廳集中聽課
線上參與方式:
加入 Zoom 會(huì)議鏈接: https://us05web.zoom.us/j/87357345709?pwd=VUc1SUNmL3dqcndnSUlCeFVOZWtVUT09
會(huì)議號(hào):873 5734 5709 密碼:123
主講人簡(jiǎn)介:

Chein-I Chang 教授于1987年畢業(yè)于美國(guó)馬里蘭大學(xué)帕克分校��,電機(jī)工程專業(yè)博士?���,F(xiàn)任美國(guó)馬里蘭大學(xué)巴爾地摩郡分校電機(jī)工程系終身教授,同時(shí)也是IEEE Life Fellow與SPIE Fellow��、大連海事大學(xué)講座教授���、臺(tái)灣中興大學(xué)遙測(cè)科技杰出講座教授���,并擔(dān)任IEEE Transaction on Geoscience and Remote Sensing、Remote Sensing等多個(gè)國(guó)際知名期刊編委�����,已發(fā)表SCI檢索學(xué)術(shù)論文200余篇����,其中超過100篇屬于高光譜領(lǐng)域,撰寫高光譜領(lǐng)域?qū)V?部����,并編著高光譜領(lǐng)域書籍3部�,授權(quán)美國(guó)專利7項(xiàng)��,Google被引次數(shù)達(dá)25000多次�,Google學(xué)術(shù)H指數(shù)為66。
講座簡(jiǎn)介:
Hyperspectral target detection can be performed in two different modes, active detection such as known target detection and passive detection such as anomaly detection. To evaluate detection performance, a general criterion is to use the area under a receiver operating characteristic (ROC) curve, AUC which is plotted based on detection probability, PD versus false alarm probability, PF. Unfortunately, Unfortunately, many ROC curves reported in the literature are indeed incorrectly generated. Another major issue is that using AUC of a ROC curve of (PD,PF), denoted by AUC(D,F) is unreliable and misleading because PD and PF are generated by the same threshold. As a result, a higher PD also generates a higher PF and vice versa. To address these two issues this talk presents a 3D ROC analysis which generates a 3D ROC curve as a function of (PD,PF,?) by including the threshold parameter as a third independent variable. Consequently, a 3D ROC curve along with its derived three 2D ROC curves of (PD,PF), (PD,?) and (PF,?) can be further used to design new quantitative measures to evaluate the effectiveness of a detector and its target detectability TD and background suppressibility (BS). To demonstrate the full utility of 3D ROC analysis in target detection, examples are included in this talk to demonstrate how 3D ROC curves can be used to design new detection measures to evaluate target/anomaly detection performance more effectively ad accurately in terms, TD, BS and detector’s effectiveness.


